


How Local Businesses Benefit from Using Google Analytics

Internet marketing has become a necessity for just any type of business; a recent Small Business Administration study has concluded that small businesses with a web presence average 39 percent greater annual sales revenue that those businesses without a website.
Consumers are largely responsible for this migration to the digital marketplace. They not only mistrust traditional advertising methods, they are abandoning the very media channels that carry them: newspaper and magazine readership is dropping, radio and television audiences are shrinking, and paper telephone directories are rapidly becoming a thing of the past.
Just as the website has become the requisite marketing tool of today’s business owner, understanding exactly how a website is performing and contributing to the bottom line has become a critical component of digital marketing success. One of the best methods for measuring website performance is through the application of Google Analytics.
How Google Analytics Works
Creating a Google Analytics account is a pretty simple and straight-forward task, and is totally free as long as your website gets 10 million or less hits per month. When your account is activated, you’ll receive a short piece of code to embed on each page of your website. If your website was built with a template such as WordPress, Google Analytics can be installed quickly with a plug-in. Once the code is installed on your site, Google Analytics will begin tracking and collecting your vital website data.
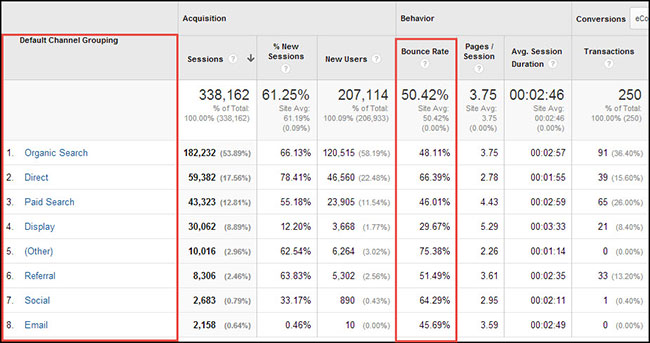
- Website traffic sources and conversions are two of the most important performance metrics that you should be tracking. When you know where your visitors are coming from and who is being converted into a customer, you can easily fine-tune your marketing campaign. Google Analytics can show you how many visitors are coming to your website through the various search engines and from your display ads and emails as well as how many conversions you’re getting from each of those channels.
- Your bounce rate measures the amount of time that visitors spend on your site before exiting, and is a good indicator of the quality of your content and overall site layout and graphics. Visitors spend more time on sites with compelling content, and will quickly leave a site that fails to live up to their expectations. Google uses bounce rate data in their ranking algorithm, and may penalize you if your bounce rate is too high.
- Visitor behavior includes the time spent on particular pages of your website, and can help you determine which pages need more work as well as which pages are your top performers and should be expanded. This “report card” can help you improve your content and lower your bounce rate.
- Google Analytics allows you to set up custom tailored key performance indicators such as online sales made, revenue generated, and number of leads generated. This type of information gives you a clear picture of what is and isn’t working, allowing you to optimize your site’s performance by testing alternative strategies.
Once you set up your custom performance indicators, you data will be collected and formatted into an easy to understand report which can be emailed directly to your inbox on a daily basis.